This content was created by Anonymous.
Screenshot: category map
1 media/ScreenShot_categoryMap_thumb.png 2023-12-07T02:06:37+00:00 Anonymous 1 1 plain 2023-12-07T02:06:37+00:00 AnonymousThis page is referenced by:
-
1
2023-12-06T19:33:25+00:00
Navigating interactive maps
21
plain
2024-02-16T21:52:23+00:00
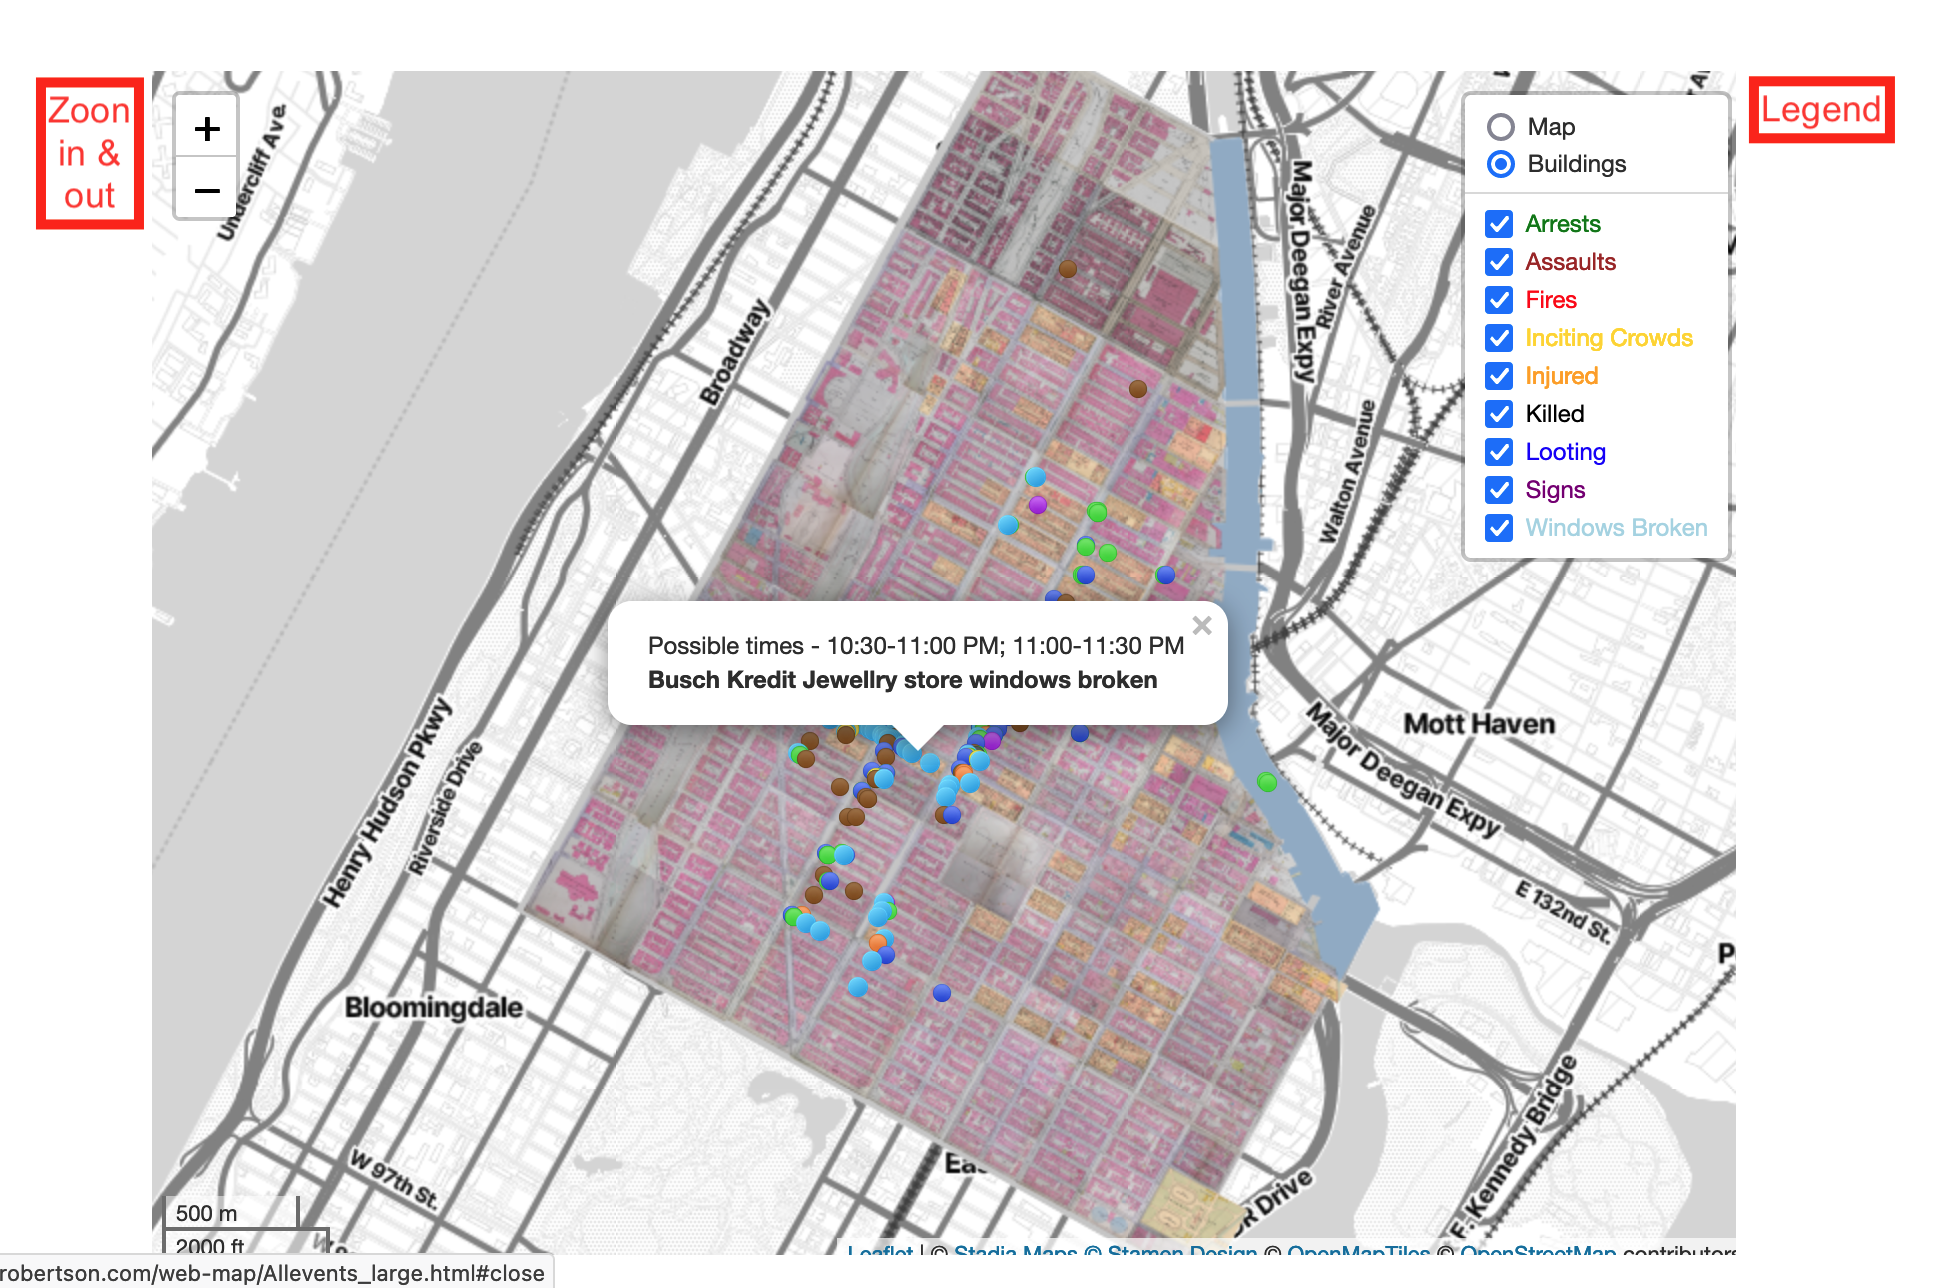
If you click on a point on the map, a popup will appear with information on the location. For events in the disorder, the popup will display the event and information on when it occurred (either a specific time or a range of time).
- The map can be zoomed in and out using the + and – buttons on the top left.
- You can move the view offered by the map by clicking and holding on the map.
- The legend on the right of the map allows you to select which categories of events appear on the map. On some maps the legend is open; if it is not, you can open it by clicking on the icon on the top right of the map. The legend also includes buttons to switch between the map layer that shows the footprints of the buildings in Harlem—a portion of the 1930 Bromley Real Estate map—and a modern map layer.
- Note: on some maps the legend is collapsed so it appears as a stack icon in the top right of the map. Clicking on that icon will open the legend.
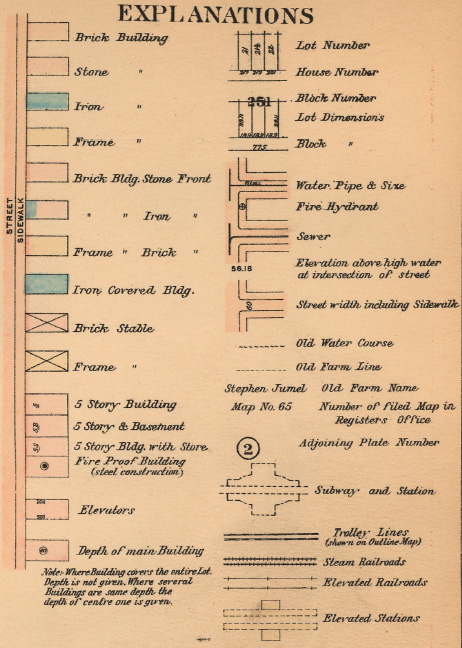
- The Bromley Real Estate map consists of stitched together pages from the author's copy of the Atlas of the City of New York, Borough of Manhattan, Volume 4, published by G. W. Bromley & Co. in 1932. The map tiles were originally created for Digital Harlem by Andrew Wilson of the University of Sydney. The map includes a variety of information about the buildings it represents, including the material from which buildings were constructed, the number of floors, and whether they included a basement and stores, as well as information on the width of streets and the presence of elevated railroad and subway lines and stations, and trolley lines. The legend below provides explanations of the symbols on the Bromley Map.
In the section on the events of the disorder, “On the Streets,” the maps that appear on each page show only those events which occurred or may have occurred in the time frame discussed on the page. A map of all the events of the disorder appears on the first page of that section.
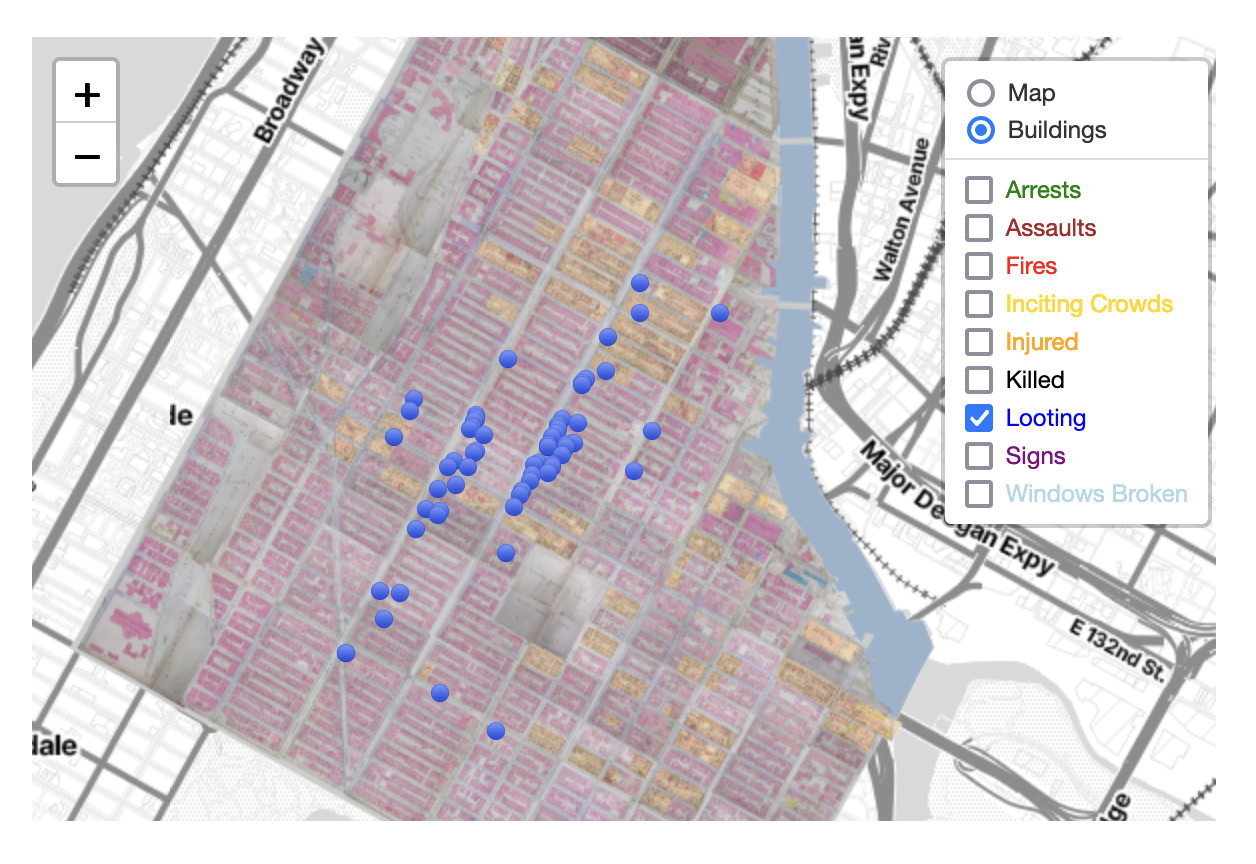
On pages covering specific categories of the events, the maps show only that category; additional categories can be added using the menu. The example below is the map of looting.
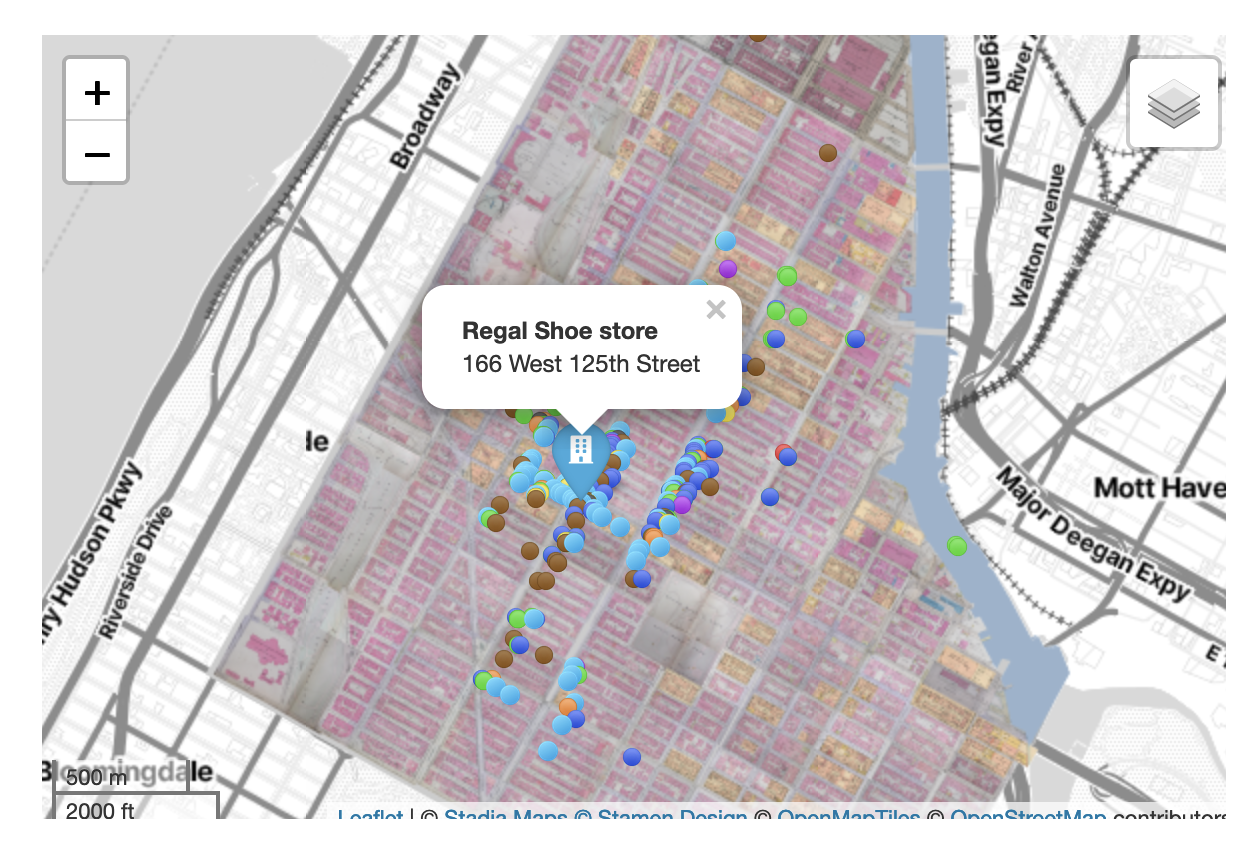
On pages about specific events, the maps show all the events of the disorder with a blue pin identifying the event that is the subject of the page or a pin with a white building icon when the event relates to a business.
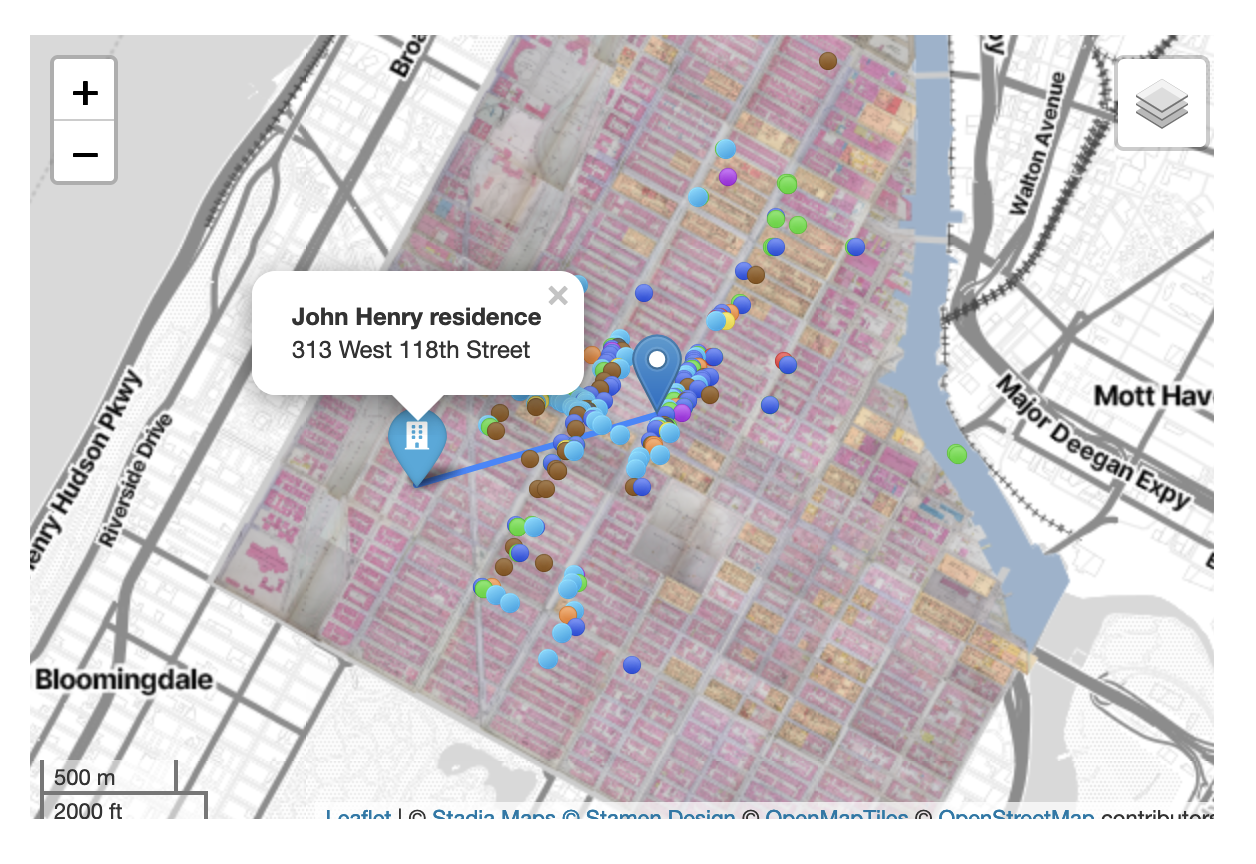
On pages about the arrest of an individual, the maps show all the events of the disorder with a blue pin identifying the arrest that is the subject of the page, a pin with a white building icon identifying where the individual lived (when that information is available), and a line linking the two locations.