This content was created by Anonymous.
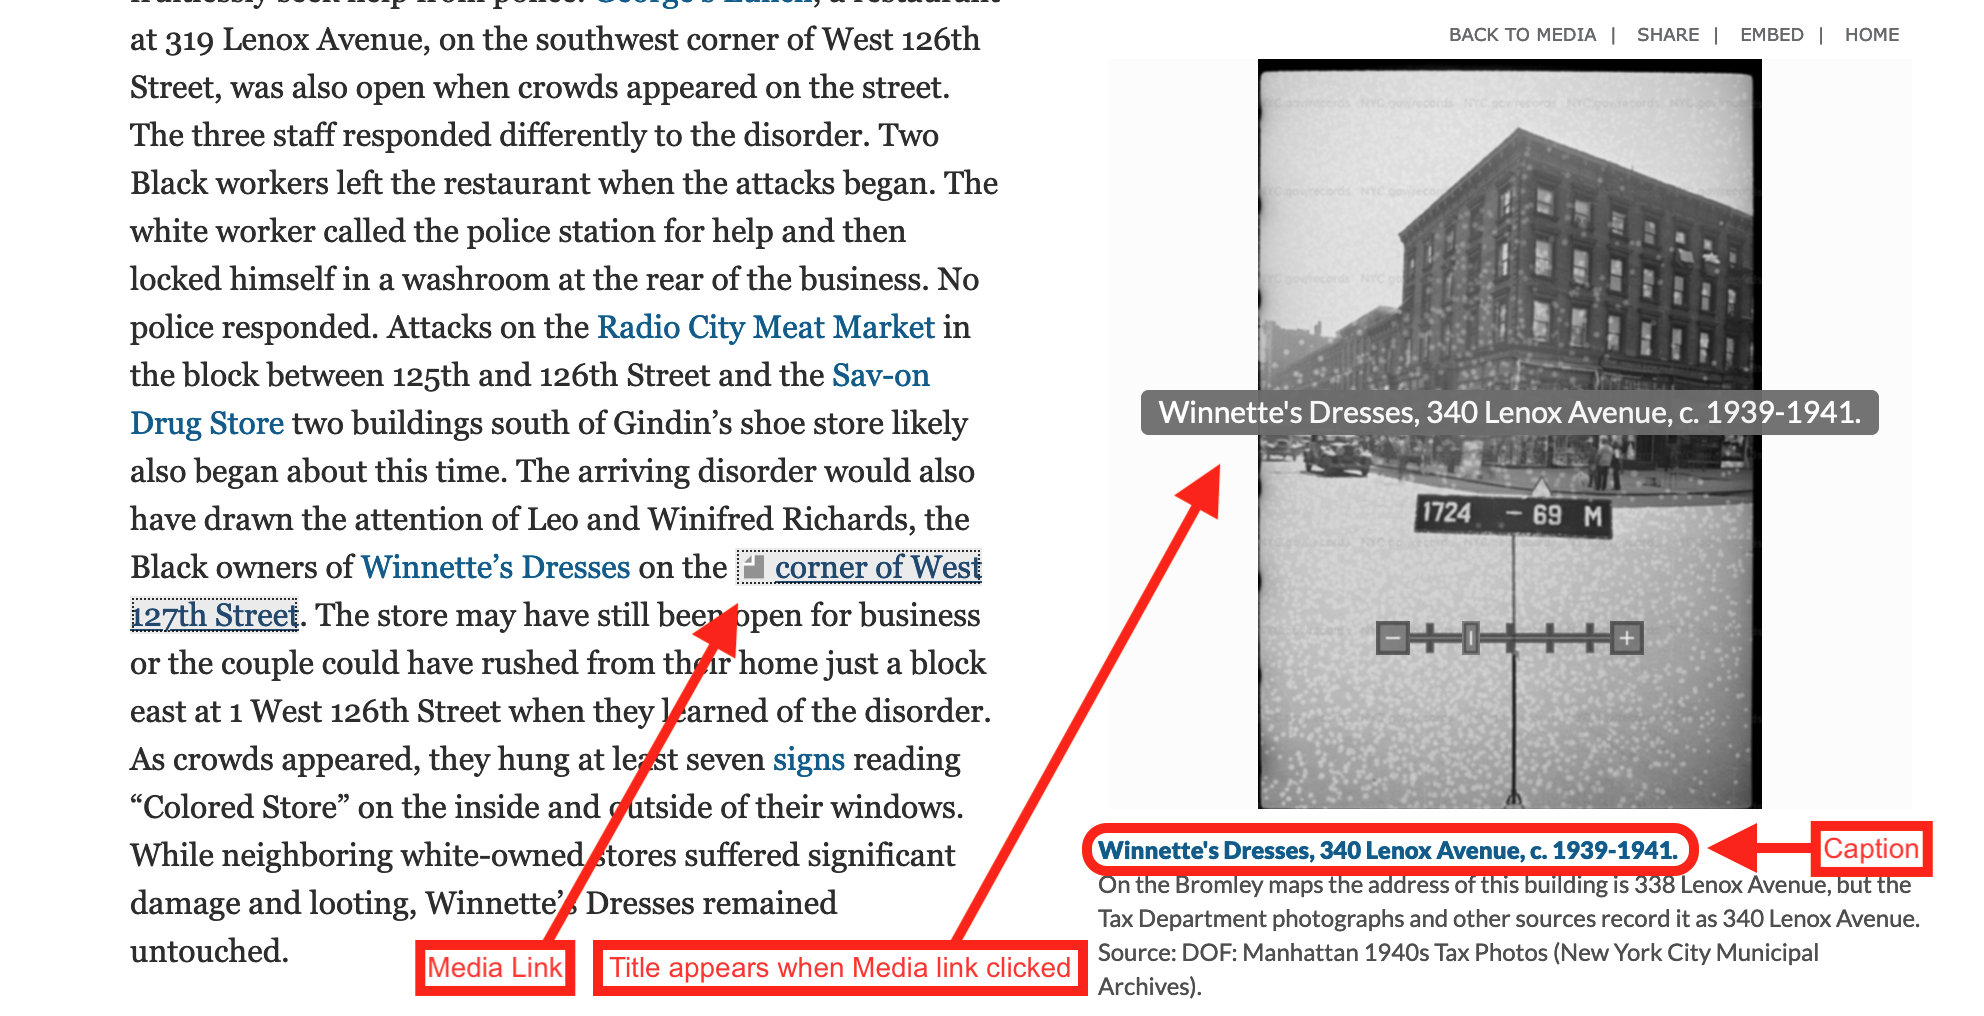
Screenshot: media link and caption
1 media/ScreenShot_MediaLinkCaption_thumb.png 2023-12-06T20:39:58+00:00 Anonymous 1 1 plain 2023-12-06T20:39:58+00:00 AnonymousThis page is referenced by:
-
1
2023-12-06T19:33:13+00:00
Navigating photographs & charts
18
plain
2024-02-25T19:36:10+00:00
Links to media in the text are indicated by a square icon with the top left corner bent. Clicking on a media link will move the page to show the photograph or chart and cause its title to appear in a grey box in the middle of the image.
If the photograph is an embedded image of a building taken by the Tax Department from 1939-1941, as in the example above, rolling your cursor over the image will cause a bar to appear: you can slide the marker on the bar or click on the - or + at either end to zoom the view in or out. Clicking on the caption of a photograph or chart (which appears as dark blue text) will open a media file page that provides a larger view of the file.
That page also displays all the citations of that media and has two blue buttons on the top right of the page that provide additional options for viewing the file.- The “View source file” button takes you to a full-page view in a new browser tab. In the case of the images of buildings taken by the Tax Department from 1939-1941, clicking that button takes you to the full-page view on the site of the New York City Municipal Archives.
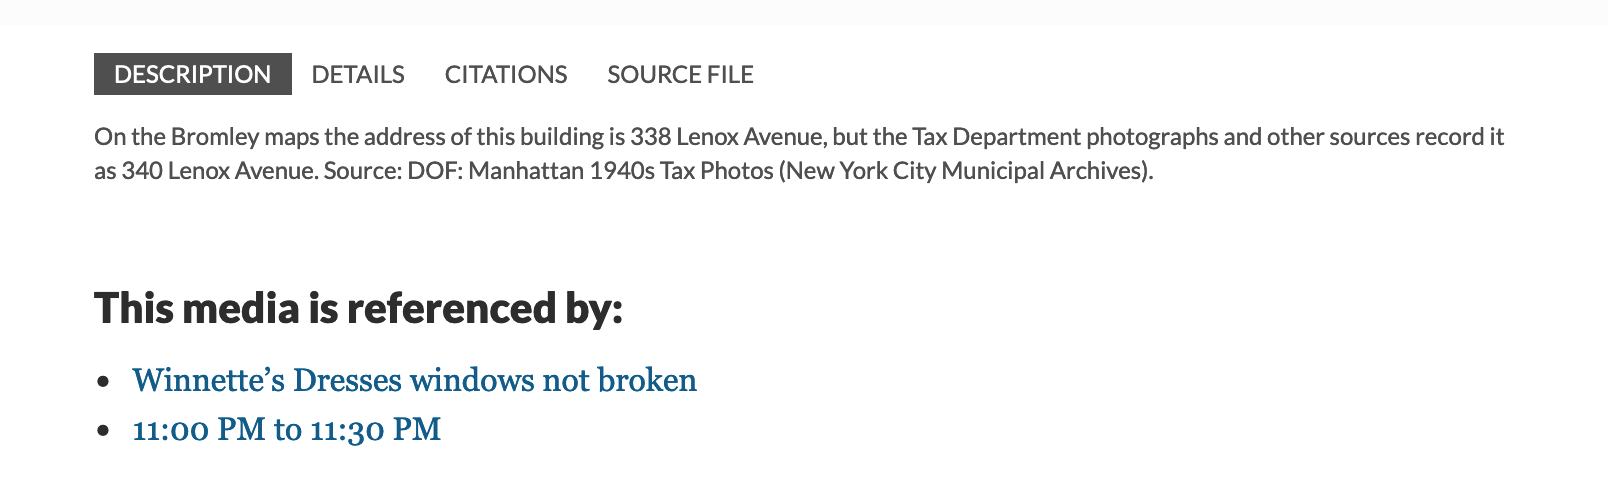
- The “View media page” button takes you to the page for that media in the Sources section. That page displays the image and below that links and tags to all the pages in the site on which that media appears and, in the case of photographs from newspapers, links to the Source page for the publications in which they appeared. The example below is from the media page for the photograph of the Winnette's Dresses store that appears in the other example images.
- Click on the X on the top right to close the page and return to the page on which the photograph or chart appeared.
The charts visualizing those involved in the events of the disorder and in the legal proceedings in its aftermath were made using Wee People, a typeface of people silhouettes developed by Alberto Cairo for ProPublica. They use male and female figures color-coded black, grey, and orange to represent racial identity and blue to represent police.